BYOC (Bring Your Own Cloud) for AWS - Private Preview
Overview
BYOC (Bring Your Own Cloud) allows you to deploy ClickHouse Cloud on your own cloud infrastructure. This is useful if you have specific requirements or constraints that prevent you from using the ClickHouse Cloud managed service.
BYOC is currently in Private Preview. If you would like access, please contact support. Refer to our Terms of Service for additional information about this private preview.
BYOC is currently only supported for AWS, with GCP and Microsoft Azure in development.
Glossary
- ClickHouse VPC: The VPC owned by ClickHouse Cloud.
- Customer BYOC VPC: The VPC owned by the customer cloud account, provisioned and managed by ClickHouse Cloud and is dedicated for a ClickHouse Cloud BYOC deployment.
- Customer VPC Other VPCs owned by the customer cloud account used for applications that need to connect to the Customer BYOC VPC.
Architecture
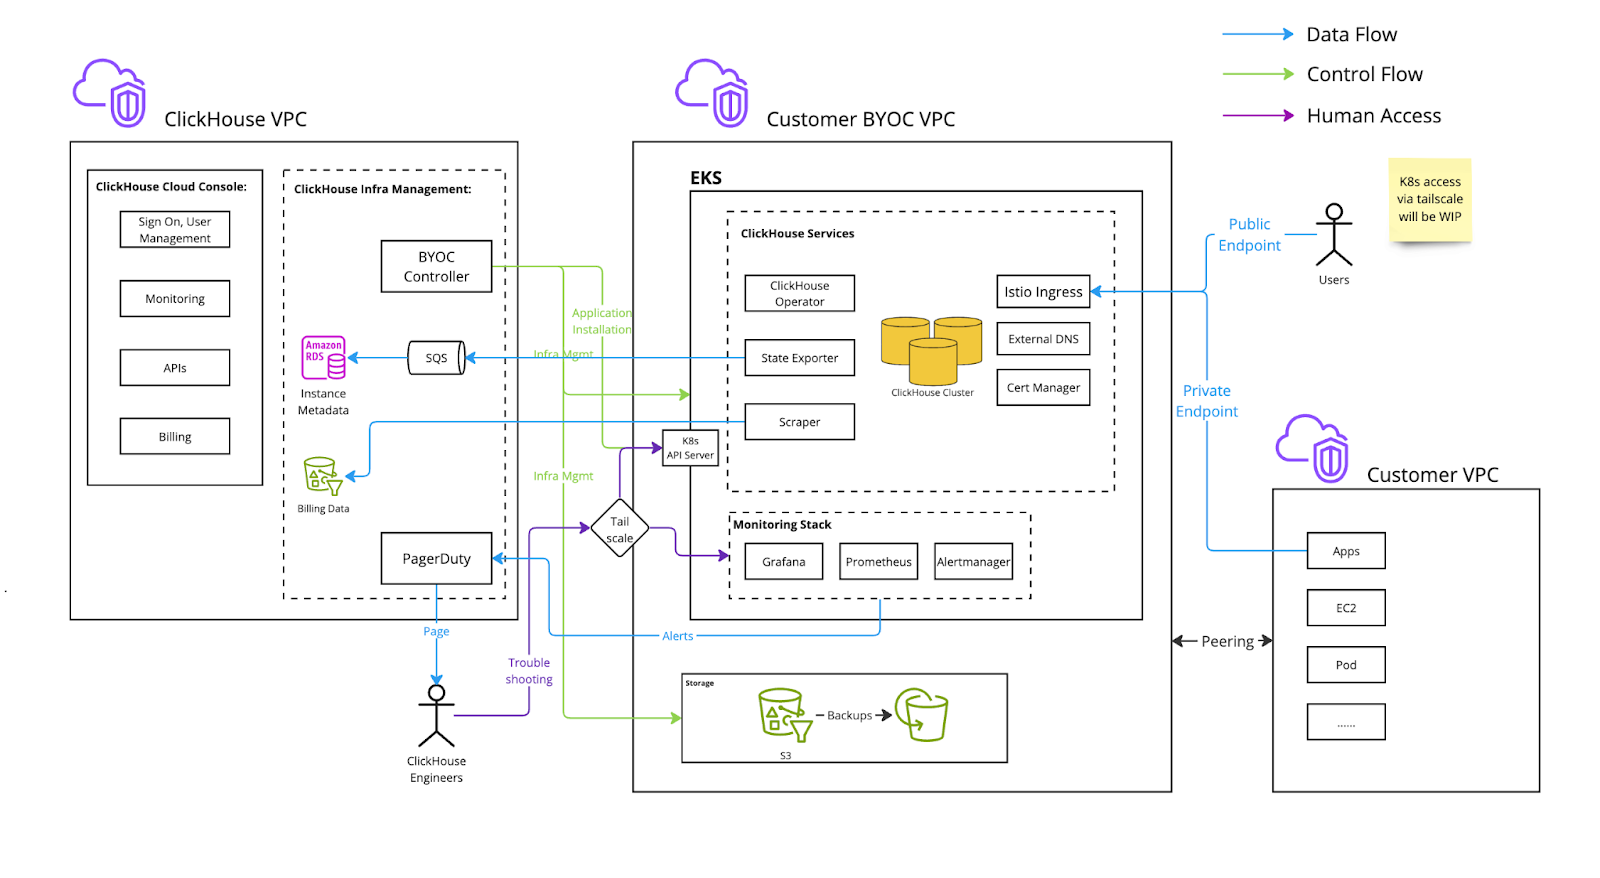
Metrics and logs are stored within the customer's BYOC VPC. Logs are currently stored in locally in EBS. In a future update, logs will be stored in LogHouse, which is a ClickHouse service in the customer's BYOC VPC. Metrics are implemented via a Prometheus and Thanos stack stored locally in the customer's BYOC VPC.

Onboarding Process
During the private preview, initiate the onboarding process by reaching out to ClickHouse support. Customers need to have a dedicated AWS account and know the region they will use. At this time, we are allowing users to launch BYOC services only in the regions that we support for ClickHouse Cloud.
BYOC setup is managed through a CloudFormation stack. This CloudFormation stack only creates a role to allow BYOC controllers from ClickHouse Cloud to set up and manage infrastructure. The S3, VPC, and compute resources used to run ClickHouse are not part of the CloudFormation stack.
Upgrade Process
We regularly upgrade the software, including ClickHouse database version upgrades, ClickHouse Operator, EKS, and other components.
While we try to make upgrades as seamless as possible (e.g., rolling upgrades and restarts), certain upgrades, such as ClickHouse version changes and EKS node upgrades, might still impact service. In such cases, customers can specify a maintenance window (e.g., every Tuesday at 1:00 a.m. PDT). We ensure that such upgrades are only performed during the scheduled maintenance window.
Note that the maintenance windows do not apply for security and vulnerability fixes. These will be handled as off-cycle upgrades, and we will communicate with customers promptly to take necessary actions and coordinate a suitable time for the upgrade to minimize the impact on operations.
CloudFormation IAM Roles
Bootstrap IAM role
The bootstrap IAM role has these permissions:
- EC2 and VPC operations are needed for setting up VPC and EKS clusters.
- S3 operations such as
s3:CreateBucketare needed for setting up buckets for ClickHouse BYOC storage. route53:*is needed for external DNS to set up the records in route53.- IAM related operations such as
iam:CreatePolicyare needed for controllers to create additional roles. See the next section for details. - eks:xx operation limited to resources that start with the
clickhouse-cloudprefix.
Additional IAM roles created by the controller
Besides the ClickHouseManagementRole created through CloudFormation, the controller will also create a few roles.
These roles are meant to be assumed by applications running within the customer EKS cluster.
- State exporter role
- ClickHouse component to report service health information back to ClickHouse Cloud.
- Requires permission to write to SQS owned by ClickHouse Cloud
- Load-balancer-controller
- Standard AWS load balancer controller
- EBS CSI Controller, to manage volumes needed by ClickHouse services
- External-dns, to propagate the DNS config to route53
- Cert-manager to provision TLS cert for BYOC services domains
- Cluster autoscaler, to scale the node group accordingly
K8s-control-plane and k8s-worker roles are meant to be assumed by AWS EKS services.
Lastly, data-plane-mgmt is to allow a ClickHouse Cloud Control Plane component to reconcile necessary custom resources such as ClickHouseCluster and the Istio Virtual Service/Gateway.
Network Boundaries
This section is focused on different network traffic to and from the customer BYOC VPC.
- Inbound: Traffic coming to the customer BYOC VPC.
- Outbound: Traffic originating from the customer BYOC VPC being sent to a destination outside that VPC
- Public: A network endpoint address available to the public internet
- Private: A network endpoint address only accessible privately, such as through VPC peering, VPC Private Link, and Tailscale
Istio ingress is deployed behind an AWS NLB to accept ClickHouse client traffic
Inbound, Public (can be Private)
The Istio ingress gateway terminates TLS. The certificate is provisioned by CertManager with LetsEncrypt and is stored as a secret within the EKS cluster. Traffic between Istio and ClickHouse is encrypted by AWS as they are in the same VPC. By default, ingress is available to the public internet with IP allowlist filtering. The customer has the option to set up VPC peering to make it private and disable public connections. We highly recommend you configure an IP filter to restrict access.
Troubleshooting access
ClickHouse Cloud engineers require troubleshooting access via Tailscale. They will be provisioned with just-in-time certificate-based authentication to BYOC deployments.
Inbound, Public (can be Private)
Billing scraper
Outbound, Private
The Billing scraper gathers billing data from ClickHouse and sends it to an S3 bucket owned by ClickHouse Cloud. The scraper is a component that acts as a sidecar next to the ClickHouse server container. It periodically scrapes CPU and memory metrics from ClickHouse. Requests to the same region will be done via VPC gateway service endpoints.
Alerts
Outbound, Public
AlertManager is configured to fire alerts to ClickHouse Cloud when the customer ClickHouse cluster is not healthy. Metrics and logs are stored within the customer's BYOC VPC. Logs are currently stored in locally in EBS. In a future update, logs will be stored in LogHouse, which is a ClickHouse service in the customer's BYOC VPC. Metrics are implemented via a Prometheus and Thanos stack stored locally in the customer's BYOC VPC.
Service state
Outbound
State Exporter sends ClickHouse service state information to an SQS owned by ClickHouse Cloud.
Features
Supported features
- SharedMergeTree: ClickHouse Cloud and BYOC use the same binary and configuration
- Console access for managing service state
- Operations supported include start, stop and terminate
- View services and status
- Backup and restore
- Manual vertical and horizontal scaling
- Runtime security monitoring and alerting via Falco (falco-metrics)
- Zero Trust Network via Tailscale
- Monitoring: The Cloud console comes with built-in health dashboards to allow users to monitor service health
- Prometheus scraping for users choosing to monitor using a centralized dashboard. We support Prometheus, Grafana and Datadog today. Refer to the Prometheus documentation for detailed instructions on setup
- VPC Peering
- Integrations listed on this page
- Secure S3
Planned features (currently unsupported)
- AWS PrivateLink
- AWS KMS aka CMEK (customer-managed encryption keys)
- ClickPipes for ingest
- Autoscaling
- Idling
- MySQL interface
FAQ
Compute
Can I create multiple services in this single EKS cluster?
Yes. The infrastructure only needs to be provisioned once for every AWS account and region combination.
Which regions do you support for BYOC?
BYOC supports the same set of regions as ClickHouse Cloud.
Will there be some resource overhead? What are the resources needed to run services other than ClickHouse instances?
Besides Clickhouse instances (ClickHouse servers and ClickHouse Keeper), we run services such as clickhouse-operator, aws-cluster-autoscaler, Istio etc. and our monitoring stack.
Currently we have 3 m5.xlarge nodes (one for each AZ) in a dedicated node group to run those workloads.
Network and Security
Can we revoke permissions set up during installation after setup is complete?
This is currently not possible.
Have you considered some future security controls for ClickHouse engineers to access customer infra for troubleshooting?
Yes. Implementing a customer controlled mechanism where customers can approve engineers' access to the cluster is on our roadmap. At the moment, engineers must go through our internal escalation process to gain just-in-time access to the cluster. This is logged and audited by our security team.
How do you set up VPC peering?
Creation and deletion of VPC peering can be done via support escalation. The prerequisite is that we need to have non-overlapping CIDR ranges between peered VPCs.
Once the VPC peering configuration is completed by ClickHouse support, there are several operations that users need to complete.
- You will receive a VPC peering request in the AWS account of the peered VPC and it needs to be accepted. Please navigate to VPC -> Peering connections -> Actions -> Accept request.
- Adjust the route table for the peered VPCs. Find the subnet in the peered VPC that needs to connect to ClickHouse instance. Edit the route table of the subnet, add one route with the following configuration:
- Destination: ClickHouse BYOC VPC CIDR (e.g. 10.0.0.0/16)
- Target: Peering Connection, pcx-12345678 (The actual ID will pop up in the dropdown list)

- Check existing security groups and make sure there is no rule blocking the access of the BYOC VPC.
The ClickHouse service should now be accessible from the peered VPC.
To access the ClickHouse service privately, a private load balancer and endpoint is provisioned for the user to connect privately from the user's peer VPC. The endpoint is similar to the public endpoint with a -private suffix. For example,
if the public endpoint is h5ju65kv87.mhp0y4dmph.us-west-2.aws.byoc.clickhouse.cloud, then the private endpoint will be h5ju65kv87-private.mhp0y4dmph.us-west-2.aws.byoc.clickhouse.cloud.
Can I choose the VPC IP range created for the EKS cluster?
You can choose the VPC CIDR range as this impacts VPC peering functionality. Please mention this in the support ticket during onboarding.
What is the size of the VPC IP range created?
We recommend reserving at least /22 for potential future scaling, but if you prefer to limit the size, it is possible to use /23 if it is likely that you will be limited to 30 server pods.
Can I decide maintenance frequency?
Contact support to schedule maintenance windows. Please expect a minimum of a bi-weekly update schedule.
Observability
Built-in Monitoring Tools
Observability Dashboard
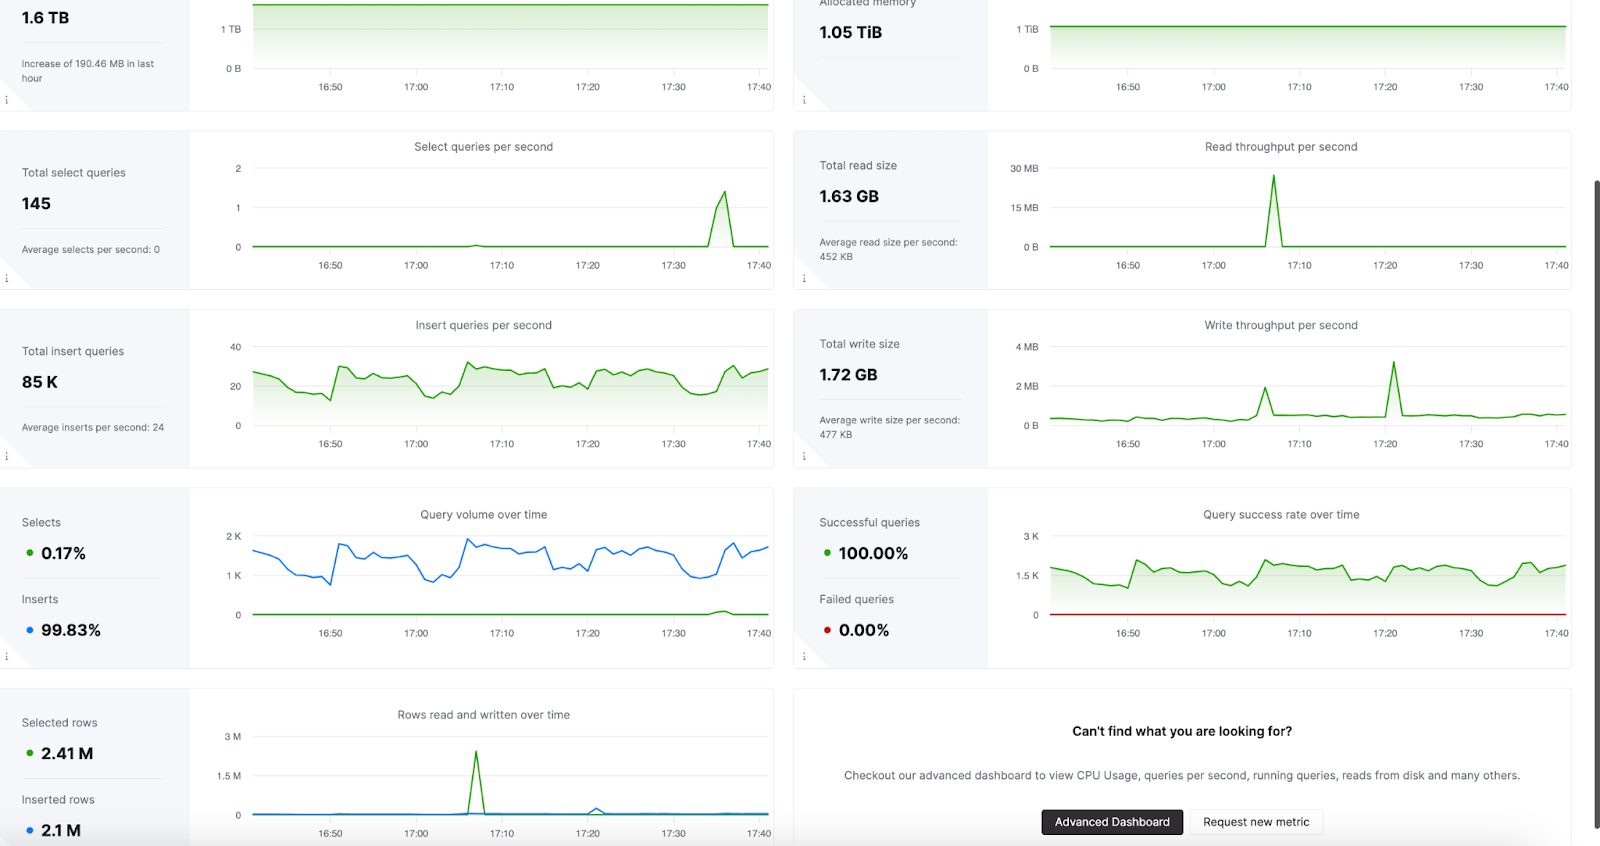
ClickHouse Cloud includes an advanced observability dashboard that displays metrics such as memory usage, query rates, and I/O. This can be accessed in the Monitoring section of ClickHouse Cloud web console interface.

Advanced Dashboard
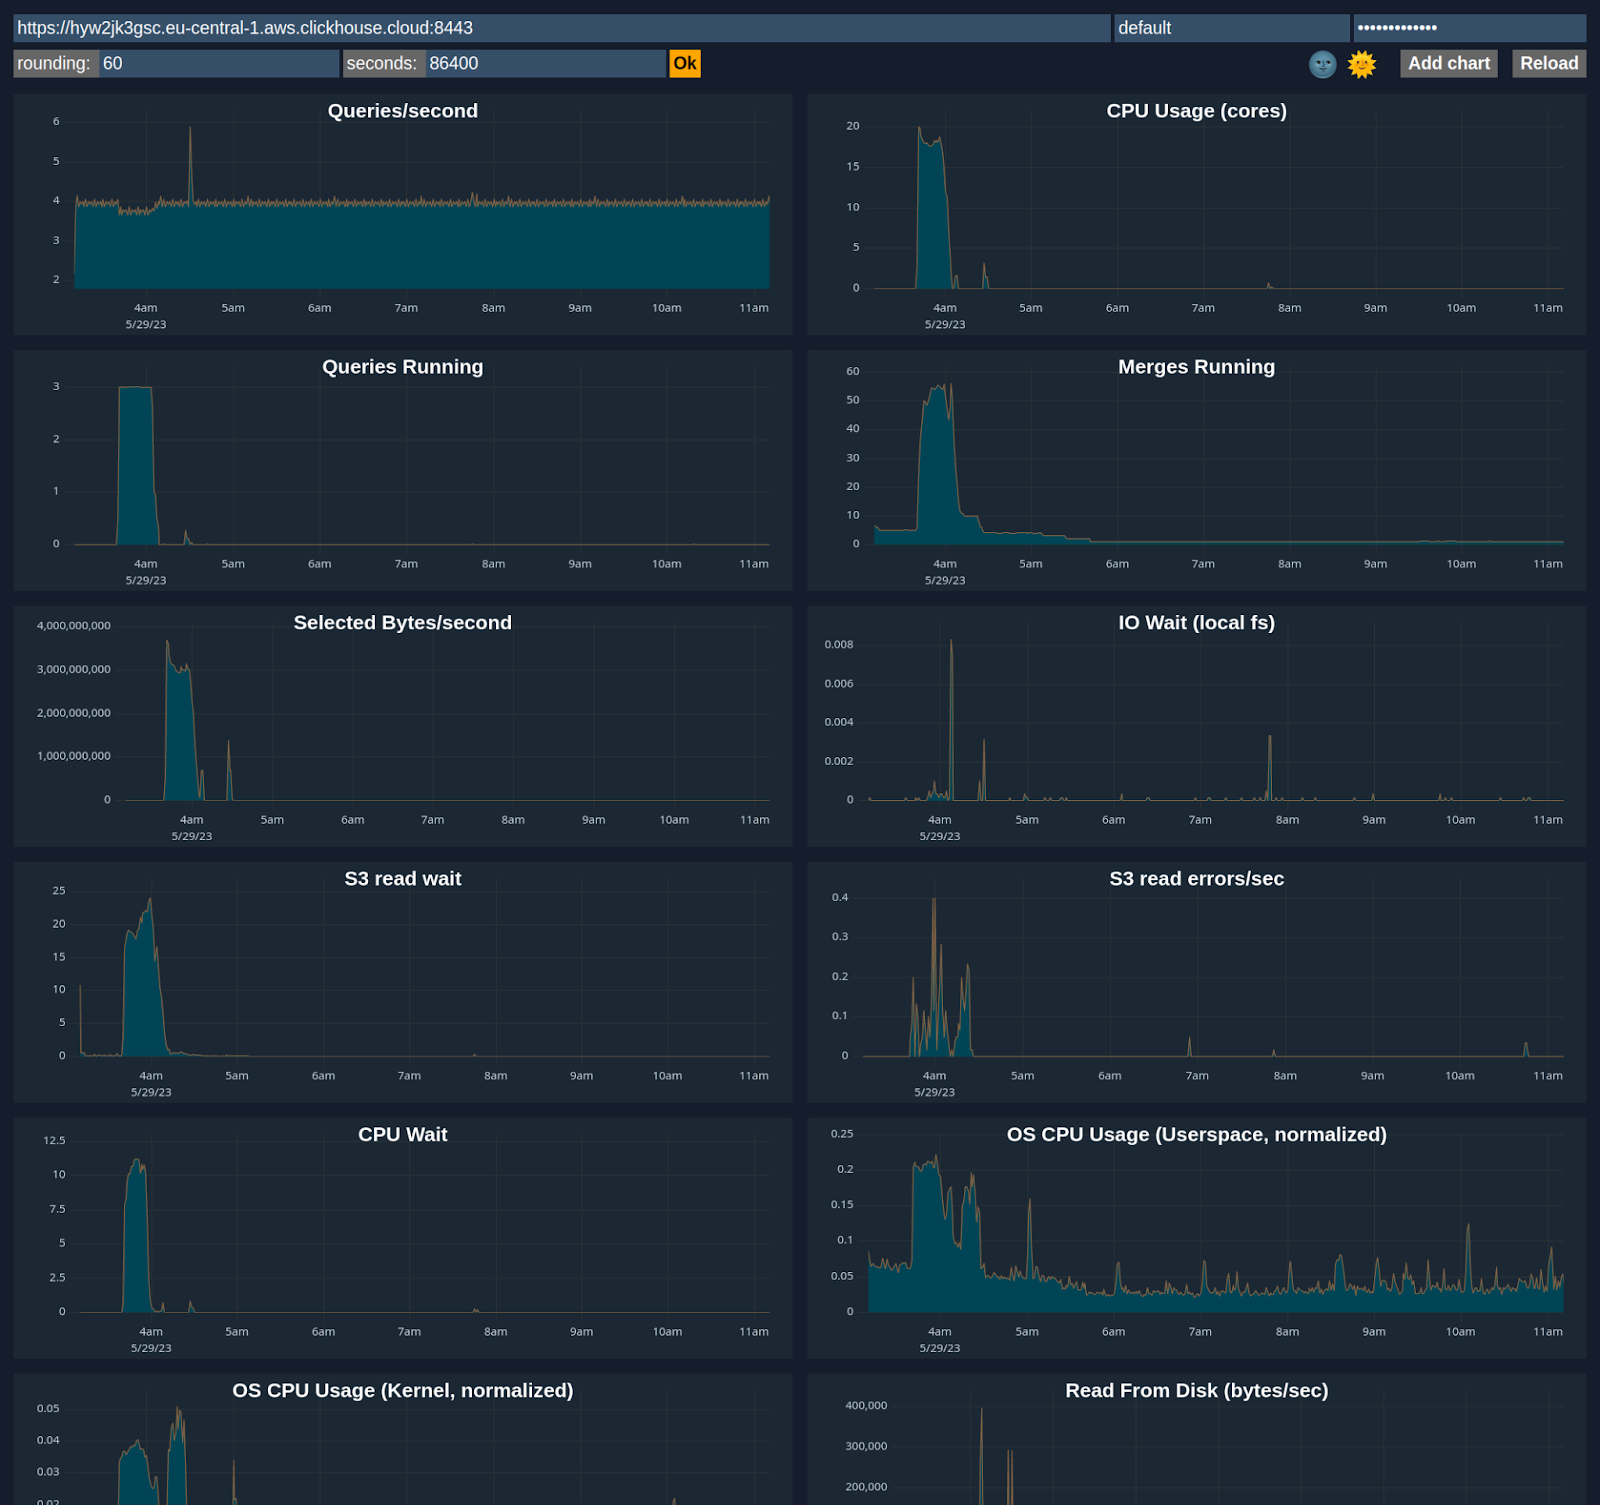
You can customize a dashboard using metrics from system tables like system.metrics, system.events, and system.asynchronous_metrics and more to monitor server performance and resource utilization in detail.

Prometheus Integration
ClickHouse Cloud provides a Prometheus endpoint that you can use to scrape metrics for monitoring. This allows for integration with tools like Grafana and Datadog for visualization.
Sample request via https endpoint /metrics_all
curl --user <username>:<password> https://i6ro4qarho.mhp0y4dmph.us-west-2.aws.byoc.clickhouse.cloud:8443/metrics_all
Sample Response
# HELP ClickHouse_CustomMetric_StorageSystemTablesS3DiskBytes The amount of bytes stored on disk `s3disk` in system database
# TYPE ClickHouse_CustomMetric_StorageSystemTablesS3DiskBytes gauge
ClickHouse_CustomMetric_StorageSystemTablesS3DiskBytes{hostname="c-jet-ax-16-server-43d5baj-0"} 62660929
# HELP ClickHouse_CustomMetric_NumberOfBrokenDetachedParts The number of broken detached parts
# TYPE ClickHouse_CustomMetric_NumberOfBrokenDetachedParts gauge
ClickHouse_CustomMetric_NumberOfBrokenDetachedParts{hostname="c-jet-ax-16-server-43d5baj-0"} 0
# HELP ClickHouse_CustomMetric_LostPartCount The age of the oldest mutation (in seconds)
# TYPE ClickHouse_CustomMetric_LostPartCount gauge
ClickHouse_CustomMetric_LostPartCount{hostname="c-jet-ax-16-server-43d5baj-0"} 0
# HELP ClickHouse_CustomMetric_NumberOfWarnings The number of warnings issued by the server. It usually indicates about possible misconfiguration
# TYPE ClickHouse_CustomMetric_NumberOfWarnings gauge
ClickHouse_CustomMetric_NumberOfWarnings{hostname="c-jet-ax-16-server-43d5baj-0"} 2
# HELP ClickHouseErrorMetric_FILE_DOESNT_EXIST FILE_DOESNT_EXIST
# TYPE ClickHouseErrorMetric_FILE_DOESNT_EXIST counter
ClickHouseErrorMetric_FILE_DOESNT_EXIST{hostname="c-jet-ax-16-server-43d5baj-0",table="system.errors"} 1
# HELP ClickHouseErrorMetric_UNKNOWN_ACCESS_TYPE UNKNOWN_ACCESS_TYPE
# TYPE ClickHouseErrorMetric_UNKNOWN_ACCESS_TYPE counter
ClickHouseErrorMetric_UNKNOWN_ACCESS_TYPE{hostname="c-jet-ax-16-server-43d5baj-0",table="system.errors"} 8
# HELP ClickHouse_CustomMetric_TotalNumberOfErrors The total number of errors on server since the last restart
# TYPE ClickHouse_CustomMetric_TotalNumberOfErrors gauge
ClickHouse_CustomMetric_TotalNumberOfErrors{hostname="c-jet-ax-16-server-43d5baj-0"} 9
Authentication
A ClickHouse username and password pair can be used for authentication. We recommend creating a dedicated user with minimal permissions for scraping metrics. A minimum, a READ permission is required on the system.custom_metrics table across replicas. For example:
GRANT REMOTE ON *.* TO scraping_user
GRANT SELECT ON system.custom_metrics TO scraping_user
Configuring Prometheus
An example configuration is shown below. The targets endpoint is the same one used for accessing the ClickHouse service.
global:
 scrape_interval: 15s

scrape_configs:
 - job_name: "prometheus"
   static_configs:
   - targets: ["localhost:9090"]
 - job_name: "clickhouse"
   static_configs:
     - targets: ["<subdomain1>.<subdomain2>.aws.byoc.clickhouse.cloud:8443"]
   scheme: https
   metrics_path: "/metrics_all"
   basic_auth:
     username: <KEY_ID>
     password: <KEY_SECRET>
   honor_labels: true
Please also see this blog post and the Prometheus setup docs for ClickHouse.